Read your analytics
Track revenue, views and conversion for each bundle over the period you choose. A Pro feature.
 Attravo TeamUpdated 1 min read
The Analytics page shows which bundles earn the most and where shoppers drop off, so you know what to promote and what to change.
Choose a period
Open Analytics and pick a period in the menu at the top: Today, Yesterday, Last 7 days, Last 30 days, Last 90 days or Last 12 months. Every number on the page follows it.
The headline numbers
- Bundle revenue: revenue from the bundles in orders placed in the period.
- Bundle orders: orders in the period that included a bundle.
- Conversion rate: bundle orders for every 100 shopper visits that included an offer.
- Avg order value: average revenue per bundle order.

Revenue over time
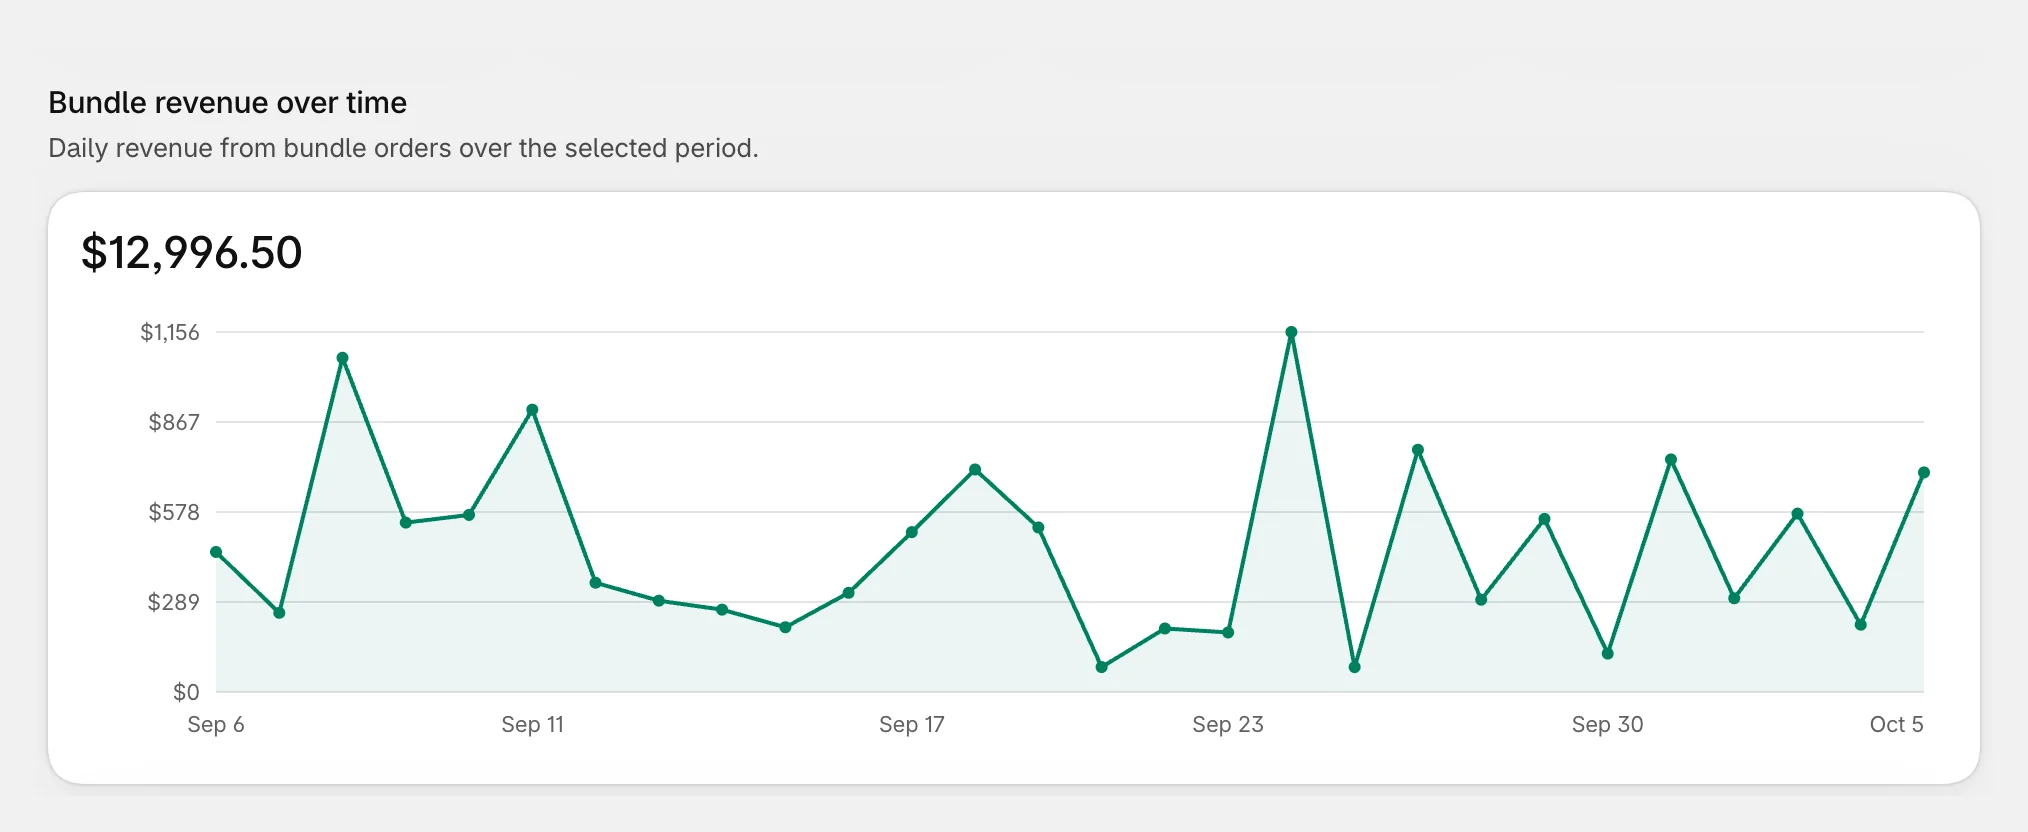
Bundle revenue over time charts each day's revenue from bundle orders, by your store's time zone.
Compare your bundles
Bundle performance lists each bundle with its Views, Add to cart, Purchases, Revenue and Conv. rate. Use Sort by to rank them.
How these are counted:
- A view is counted once per bundle per shopper visit, when the bundle shows on your store.
- Add to cart counts adds from the bundle widget's own buttons.
- Conv. rate is purchases divided by views.
Breakdowns
- Views by bundle: your top 5 bundles by views.
- Revenue by type: how revenue splits across bundle types.
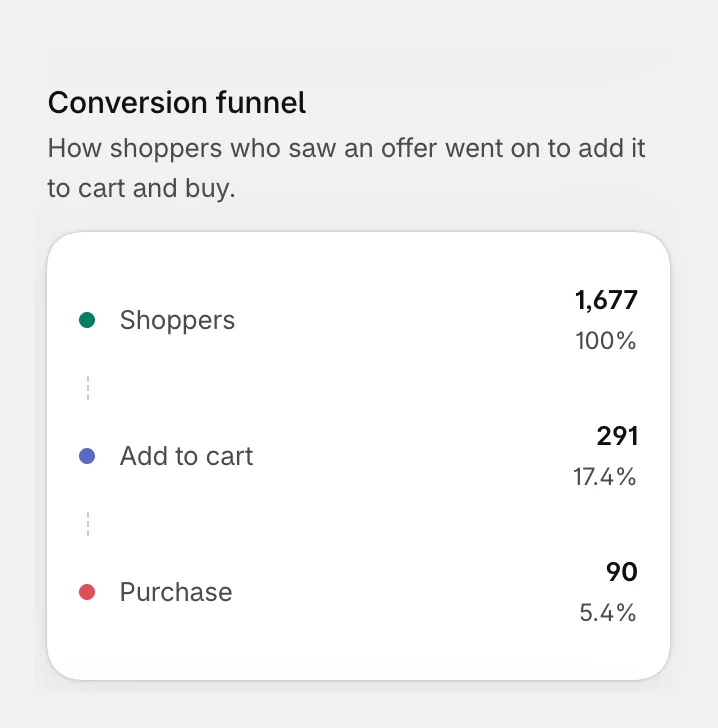
- Conversion funnel: how shoppers who saw an offer went on to add it to cart and buy.
Refunds and cancellations aren't taken off these numbers.
Was this helpful?