Read your Performance report
Understand every figure on Performance, from Earned to revenue per visit, and compare periods.
 Attravo TeamUpdated 2 min read
On this page
Performance shows what your offers earned and why, so you can tell which offers to keep, change or stop. Every figure counts only money that was actually paid.
Choose the funnel and period
At the top, pick All funnels or one funnel, and a period: Last 7 days, Last 30 days, Last 90 days, This month, Last month or All time. Each figure is compared with the period before.

Days and months follow your store's timezone. All time has nothing earlier to compare with.
Headline figures
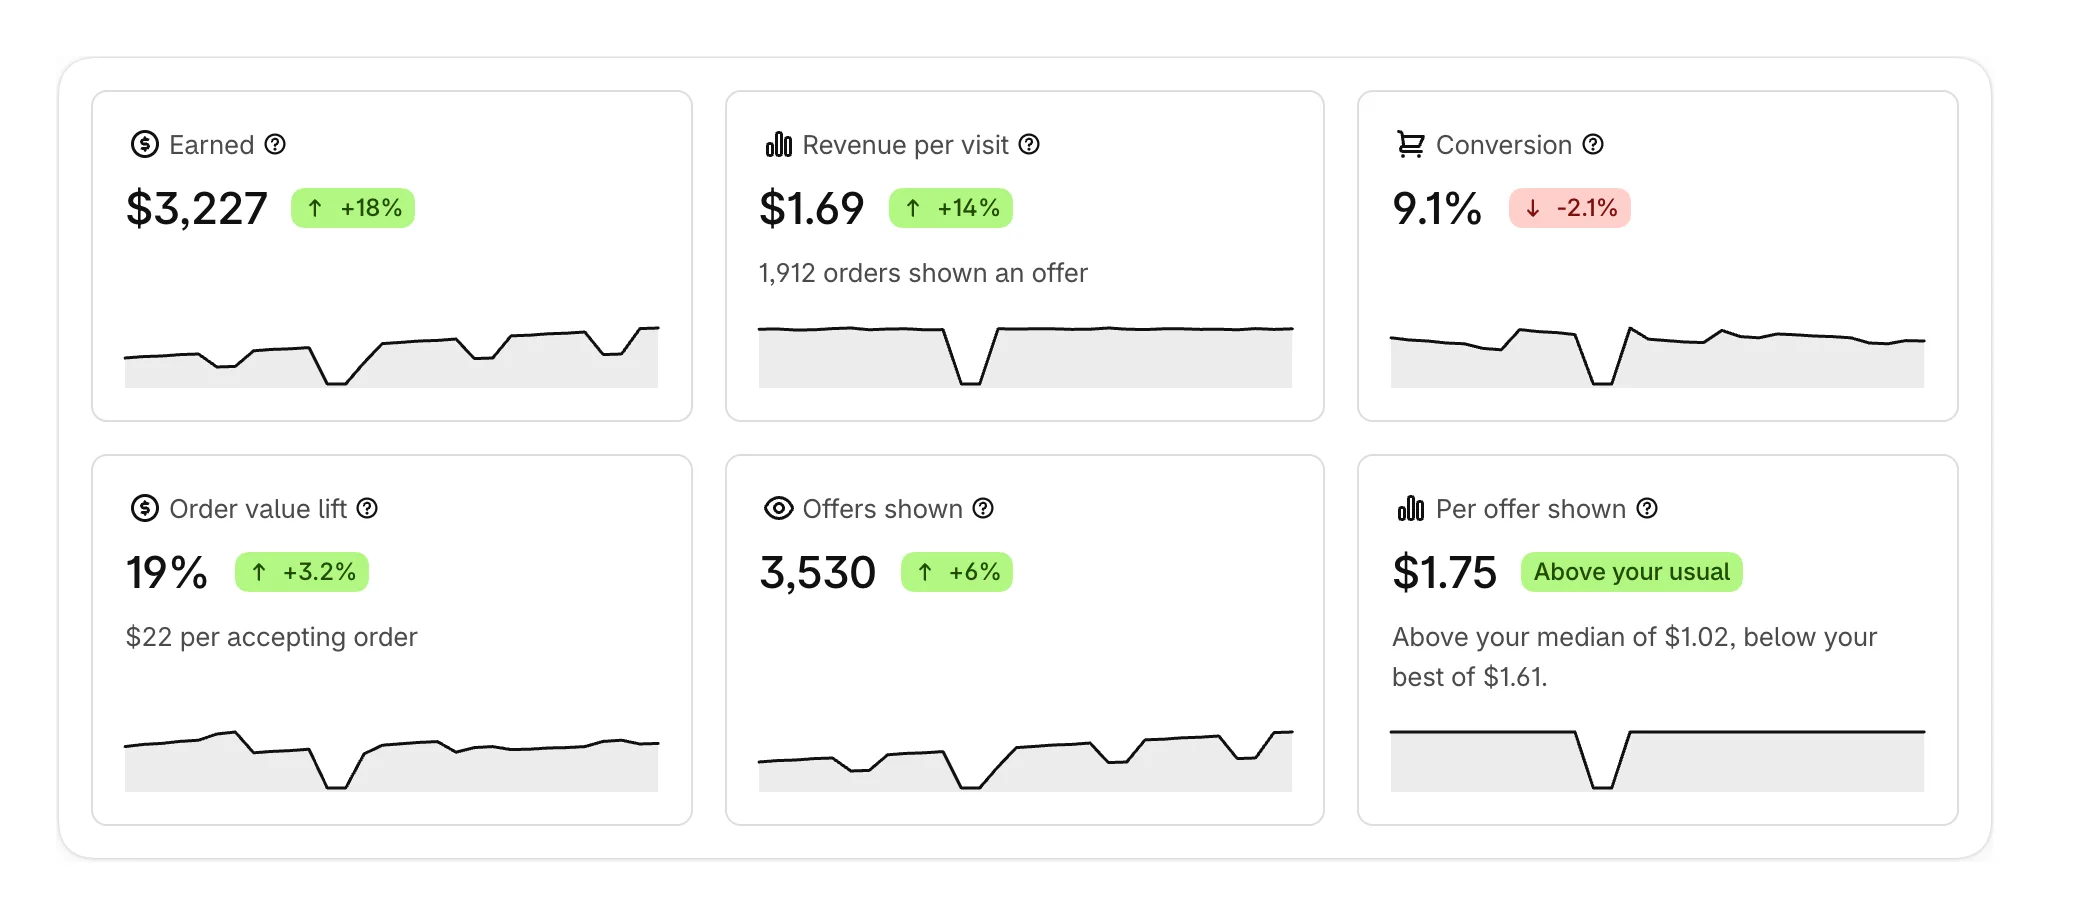
| Figure | What it counts |
|---|---|
| Earned | Money from accepted offers that was collected in the period. Refunds and cancellations are taken back out. |
| Revenue per visit | Earned divided by orders shown at least one offer. It rises whether more customers say yes or the ones who do spend more. |
| Conversion | Accepted divided by shown. Useful within one offer, misleading between offers shown to different numbers of people. |
| Order value lift | What an accepted offer added to its order, as a share of the order's total when the offer appeared. |
| Offers shown | How many times a customer was shown an offer. One buyer seeing two steps counts twice. |
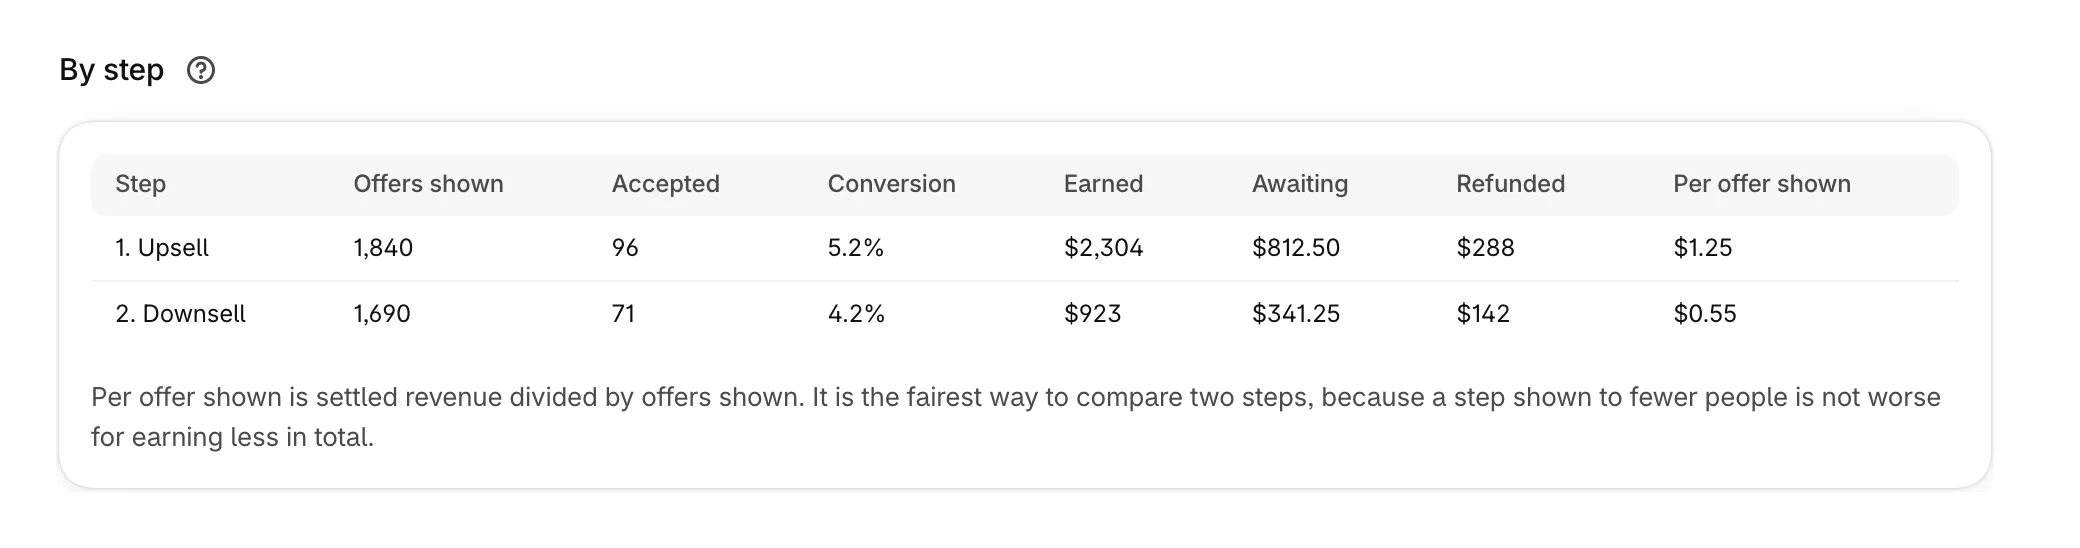
| Per offer shown | Earned divided by offers shown. The fairest way to compare two offers. |
Hover the question mark beside any figure to read how it is counted.
Per offer shown also says how this period compares with your usual and your best period. Every comparison is against your own store's history, never other stores.
What the offers cost and add
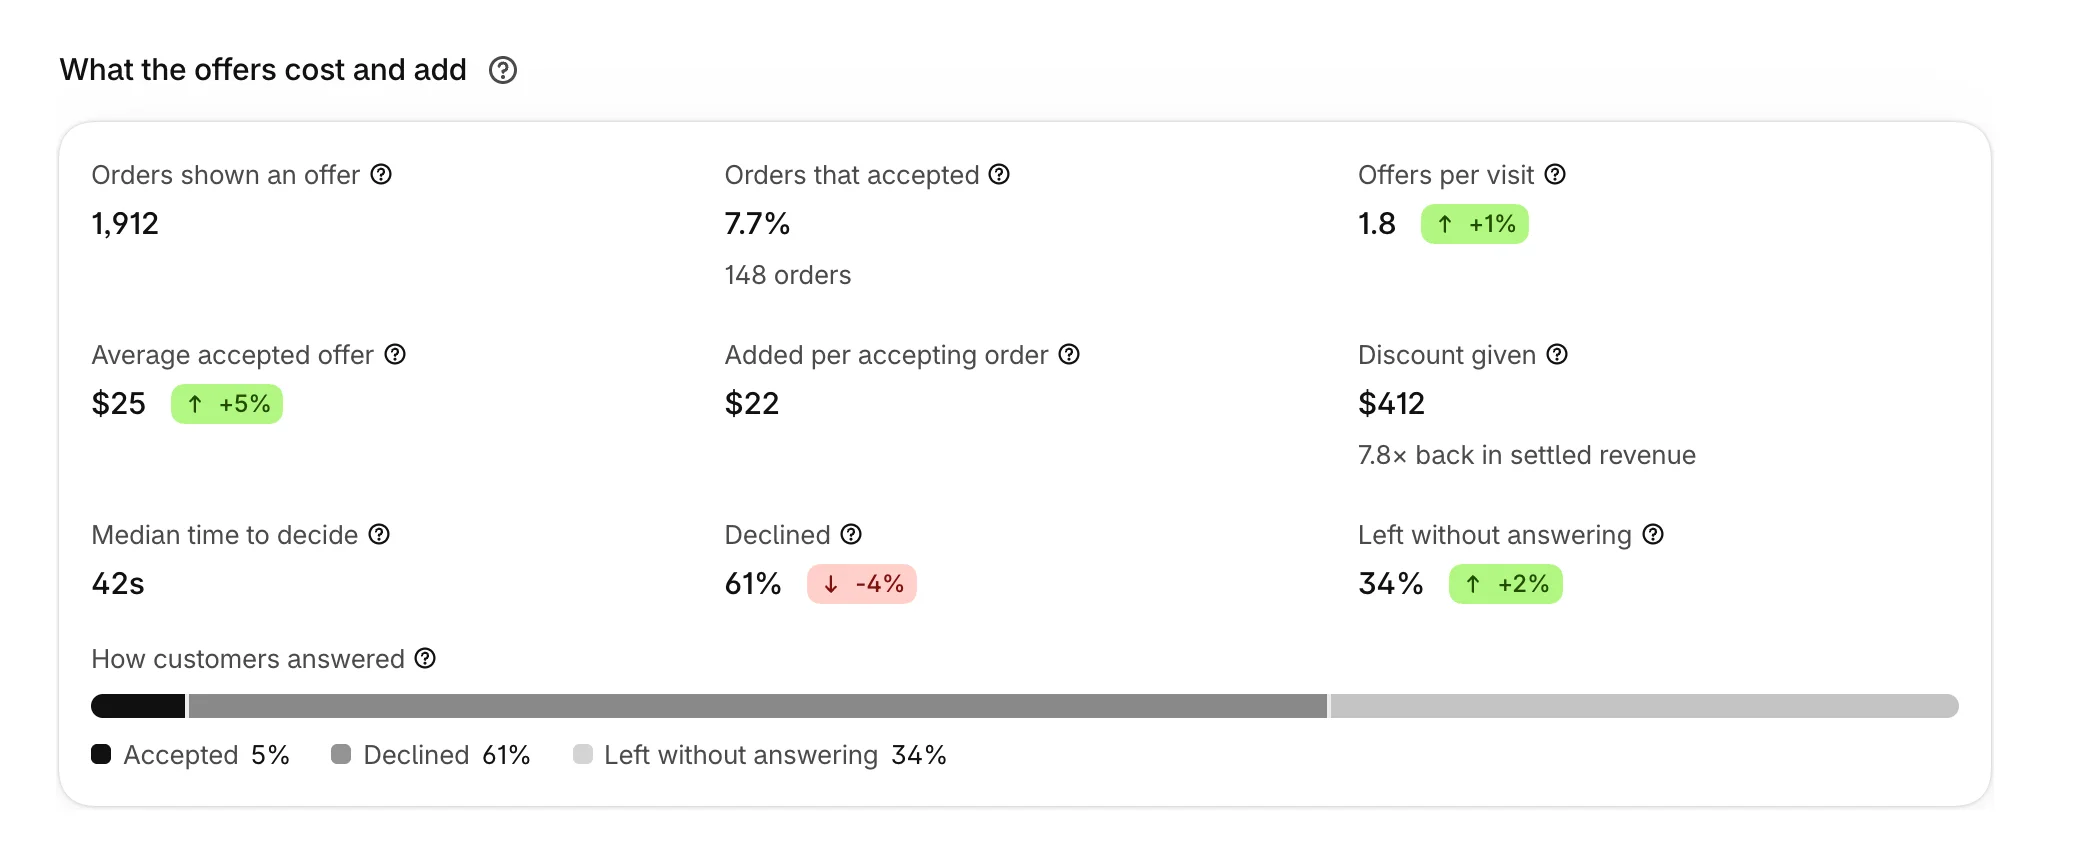
How accepting changed the orders it joined: orders shown an offer, orders that accepted, offers per visit, the average accepted offer, what each accepting order grew by, the discount given and what it brought back, how long customers took to decide, and how many declined or left without answering.
Over time
Four charts: Earned, Revenue per visit, Offers shown and Conversion. Hover a day to see its figure.
Where the money comes from
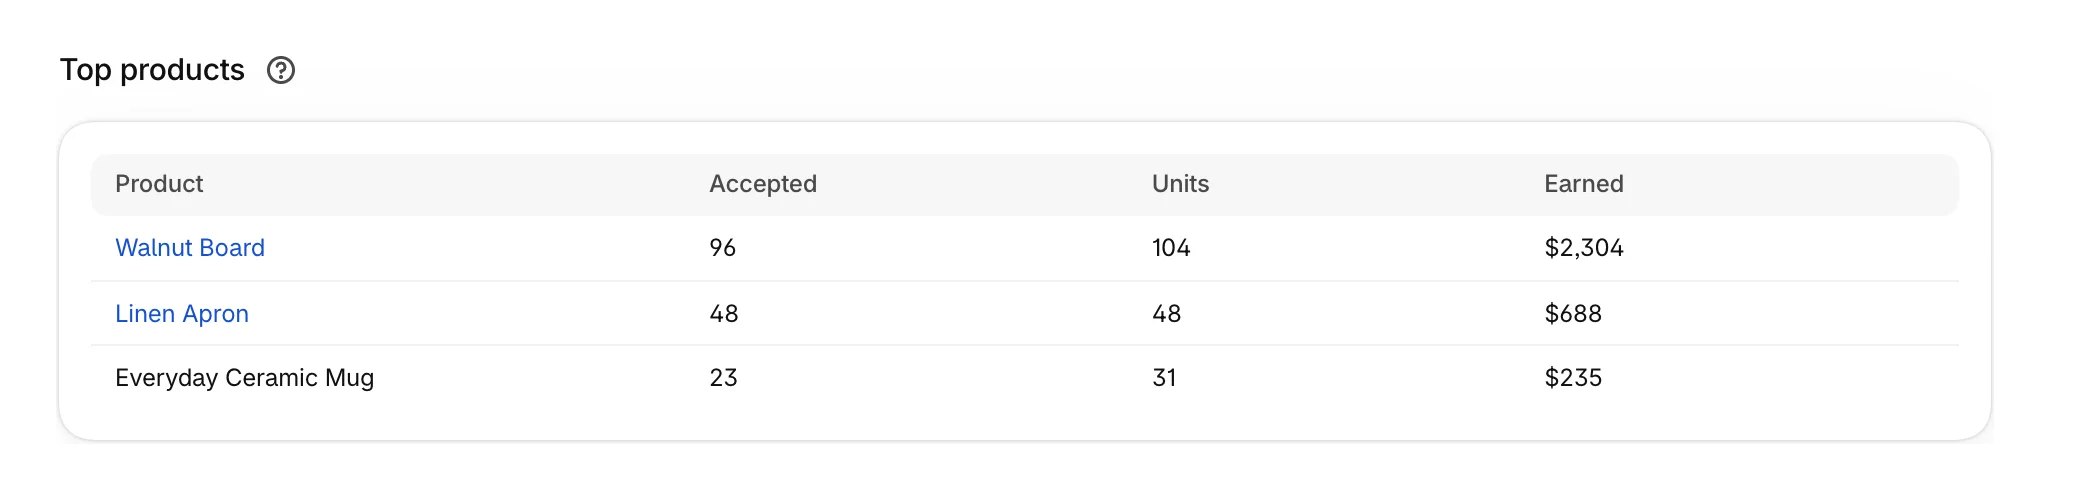
- Top products: the products customers said yes to, most earned first.
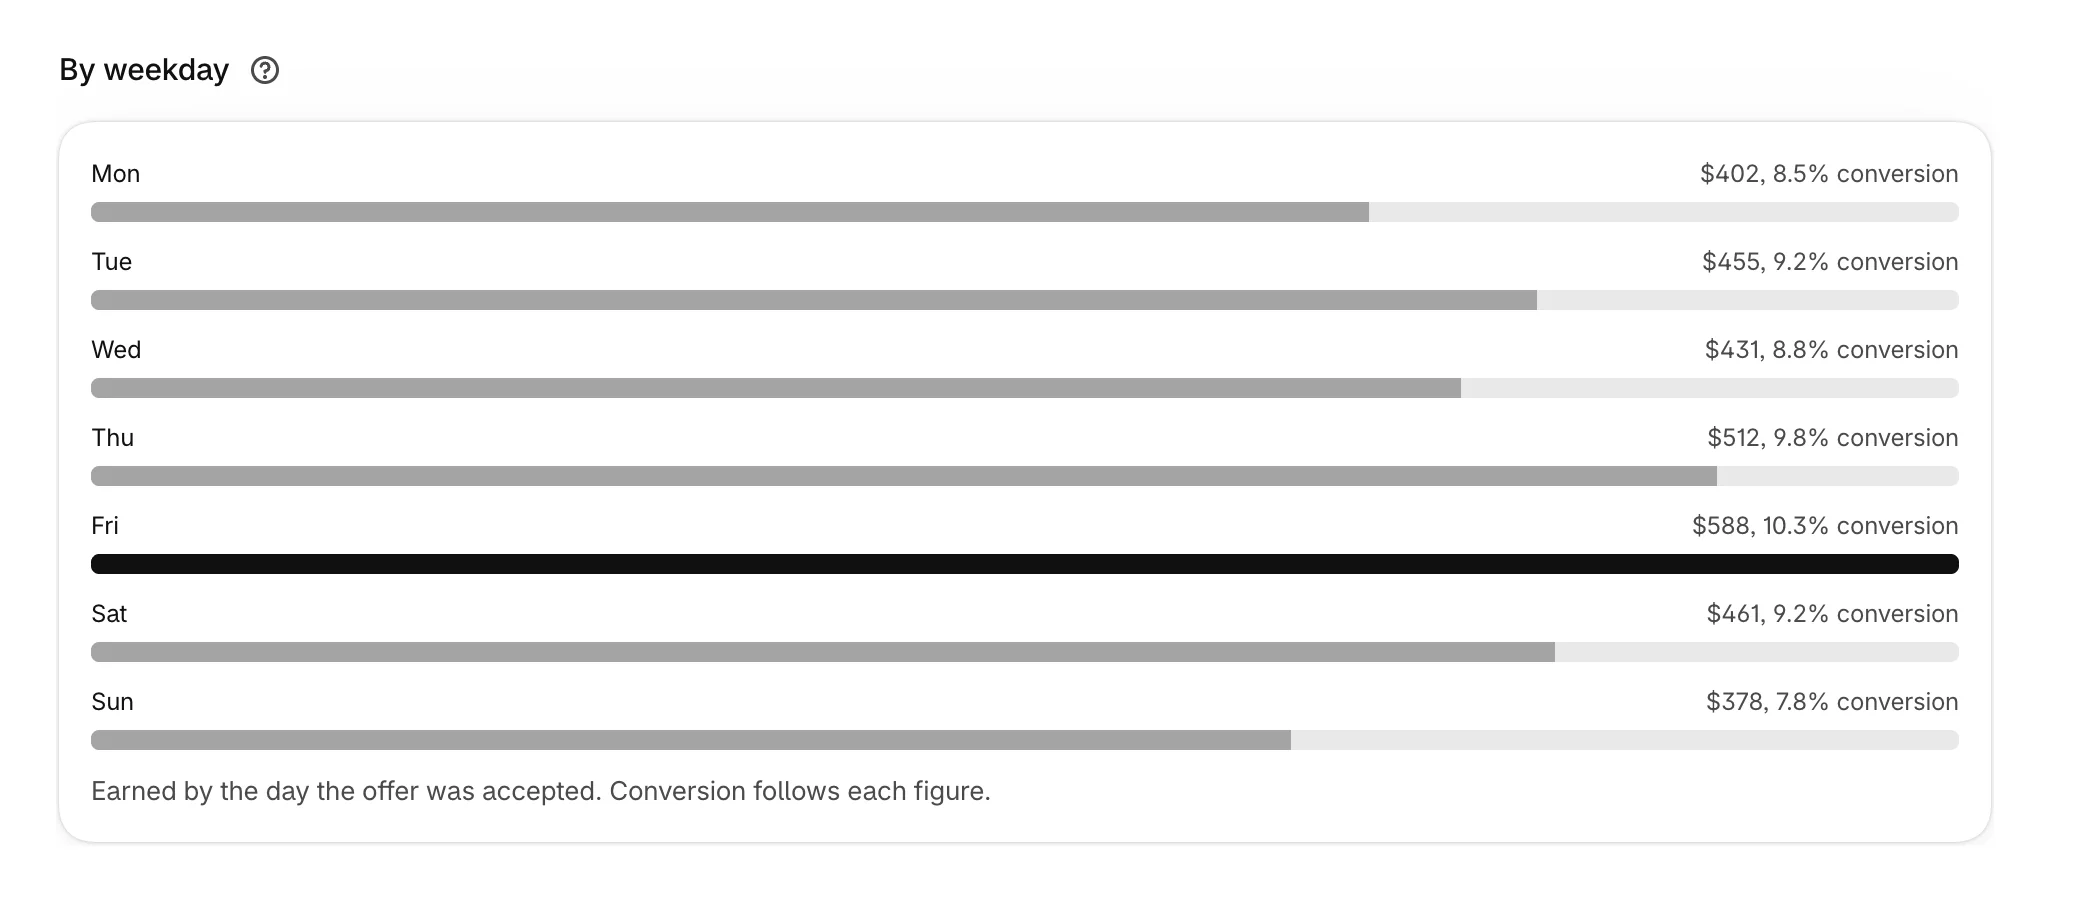
- By weekday: earned and conversion for each day of the week, with the best day marked.
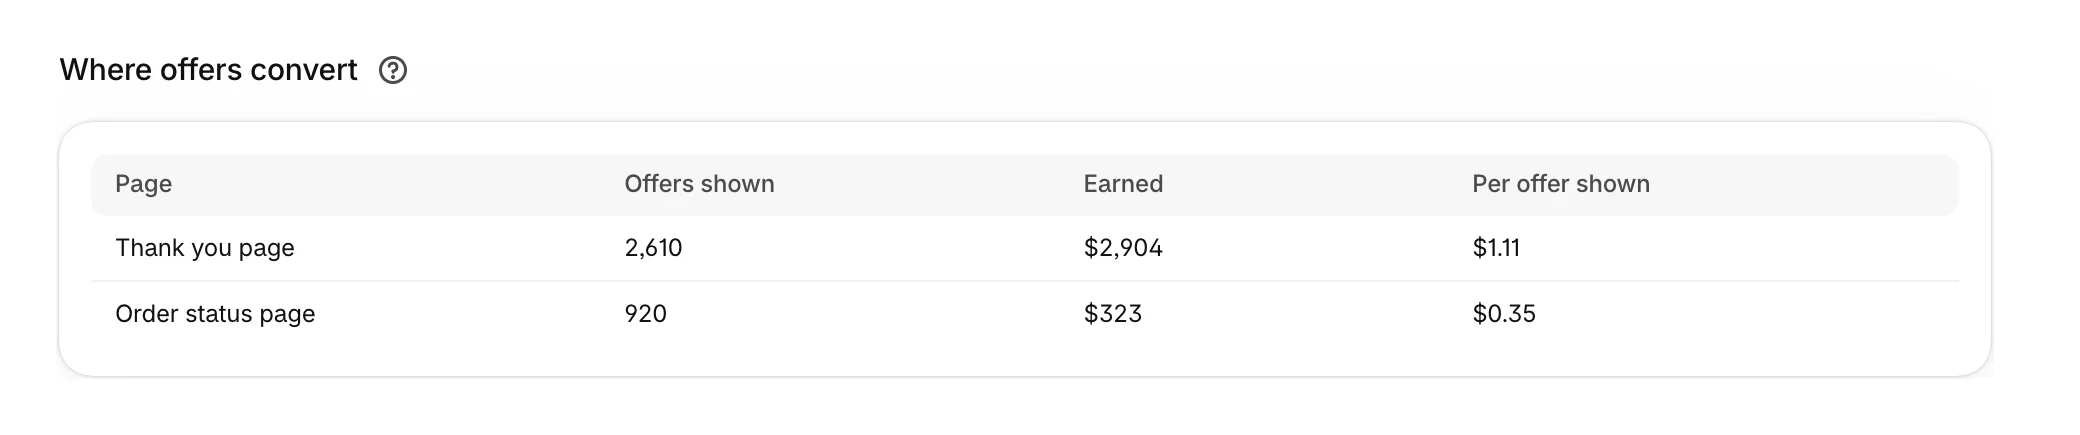
- Where offers convert: each page's offers shown and earned.
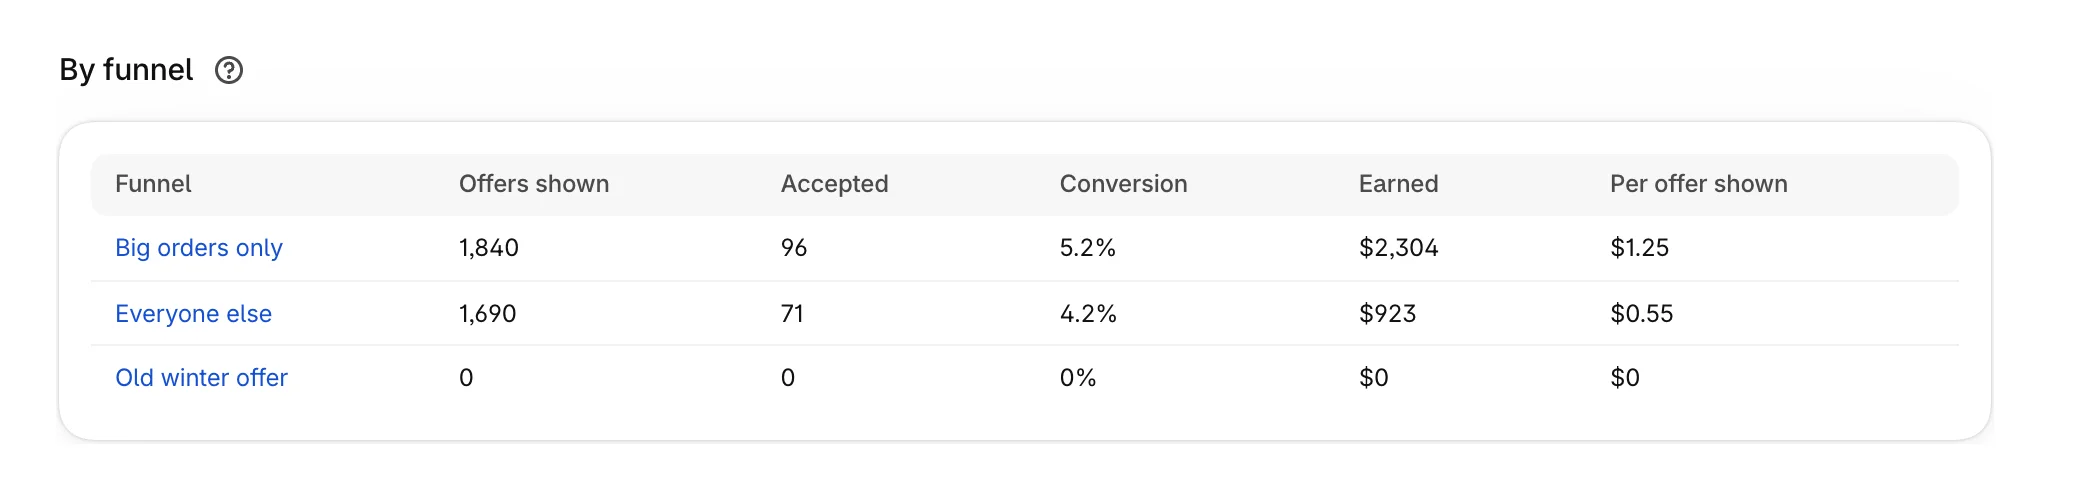
- By funnel, with all funnels picked, or By step with one funnel picked. Compare per offer shown, because later steps are seen by fewer customers.
To understand how amounts become Earned, see How Attravo counts revenue.
Was this helpful?
More in Results
- How Attravo counts revenueLearn when an accepted offer counts as Earned, and how refunds, cancellations and unpaid orders are handled.
- Read A/B test resultsSee how each version of a step performs, and when Attravo is confident enough to call a winner.
- Act on What to do nextUse the suggestions on Performance to fix weak offers and keep test winners, ordered by what each is worth.