See which offers sell
On Pro, follow shoppers from opening the cart to placing an order, see which offers they add and buy, and export your figures.
 Attravo TeamUpdated 1 min read
Pro adds four sections to Analytics that show where shoppers drop off and which offers earn their place. They follow the date range at the top of the page.
Cart funnel
The funnel follows shoppers from opening the cart to placing an order.
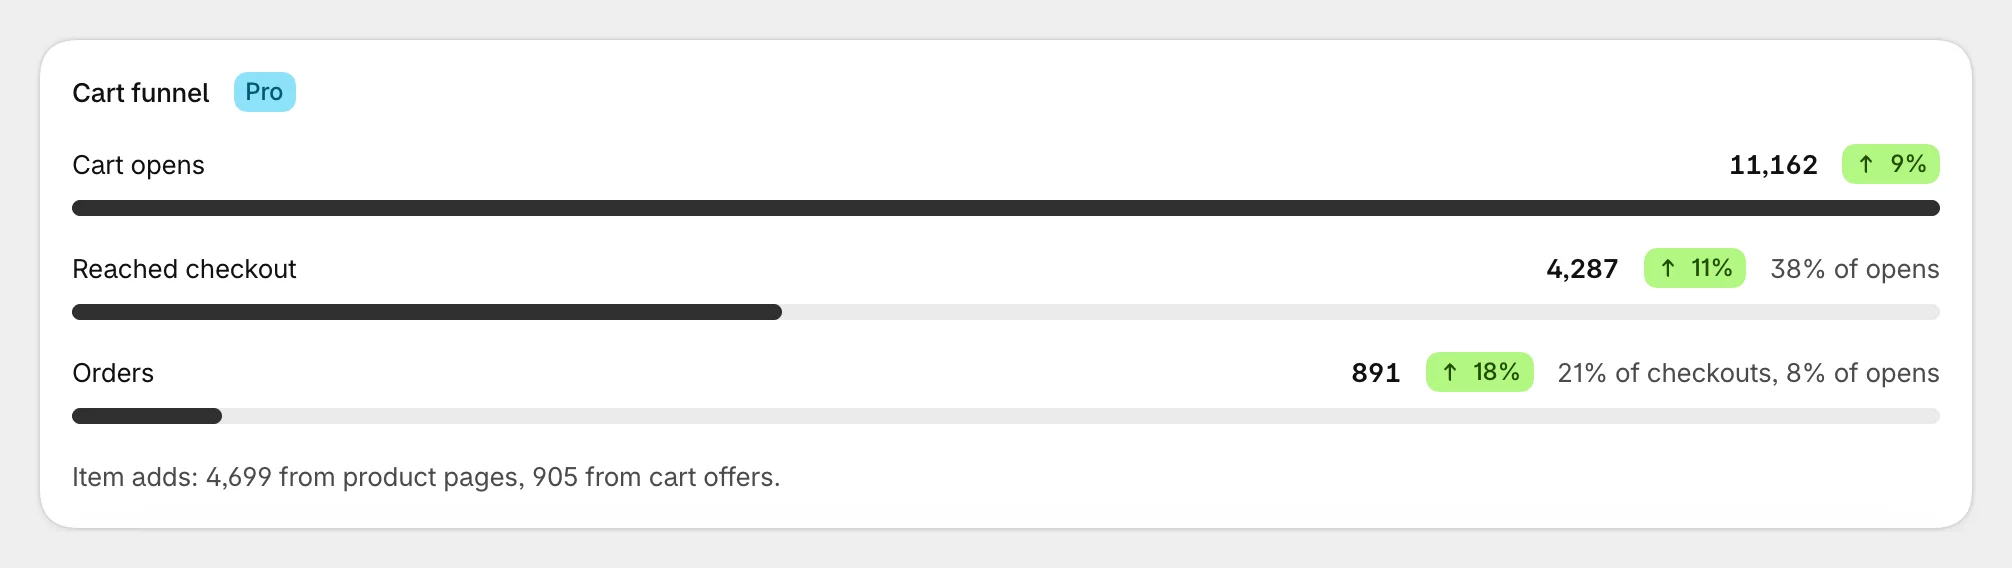
- Cart opens: times the cart was opened.
- Reached checkout: times a shopper went on to checkout, with its share of opens.
- Orders: orders the cart influenced, with their share of checkouts and of opens.
Under it, Item adds shows how many products were added from product pages and how many from the cart's offers.
Offer performance
The table lists your ten most-added offer products.
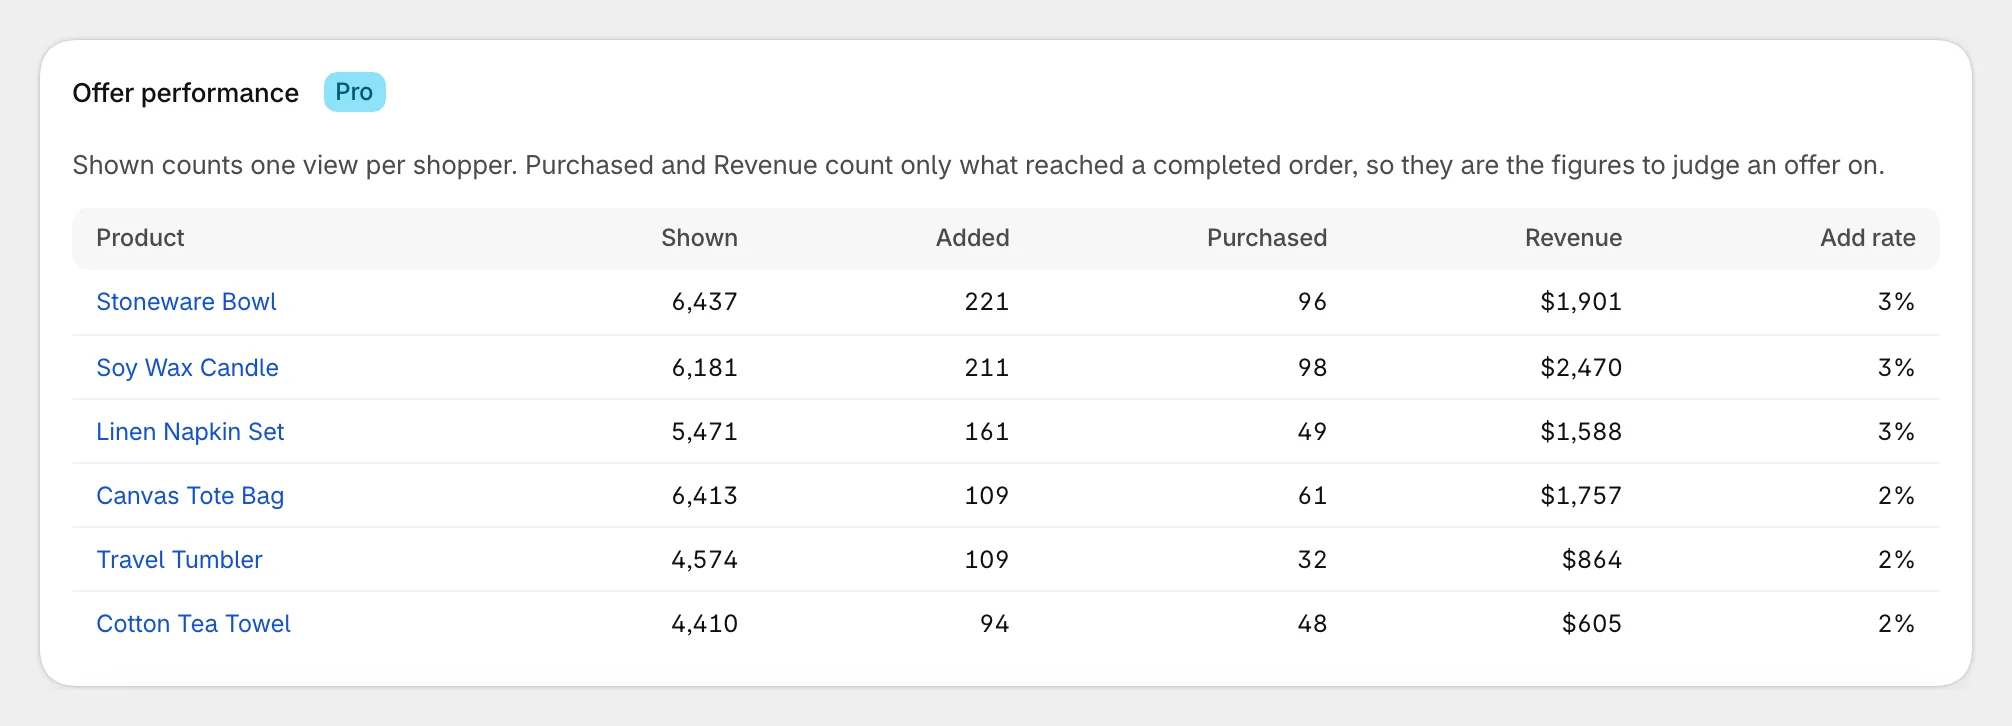
- Shown: how many shoppers saw the product in the offers. Each shopper counts once.
- Added: how many times it was added from the offers.
- Purchased and Revenue: what reached a completed order. These are the figures to judge an offer on.
- Add rate: added as a share of shown. It shows in green at 5% or more, once a product has been shown at least 10 times.
Select a product's name to open it in your Shopify admin.
Advanced analytics

- Average upsell per order: upsell revenue divided by orders influenced.
- Quantity-break orders: orders that took a quantity break.
- Orders with a free gift.
Select Export CSV to download the range day by day, or week or month by month for long ranges, with upsell revenue, orders, gifts, quantity-break orders and gift orders.
Thank-you codes
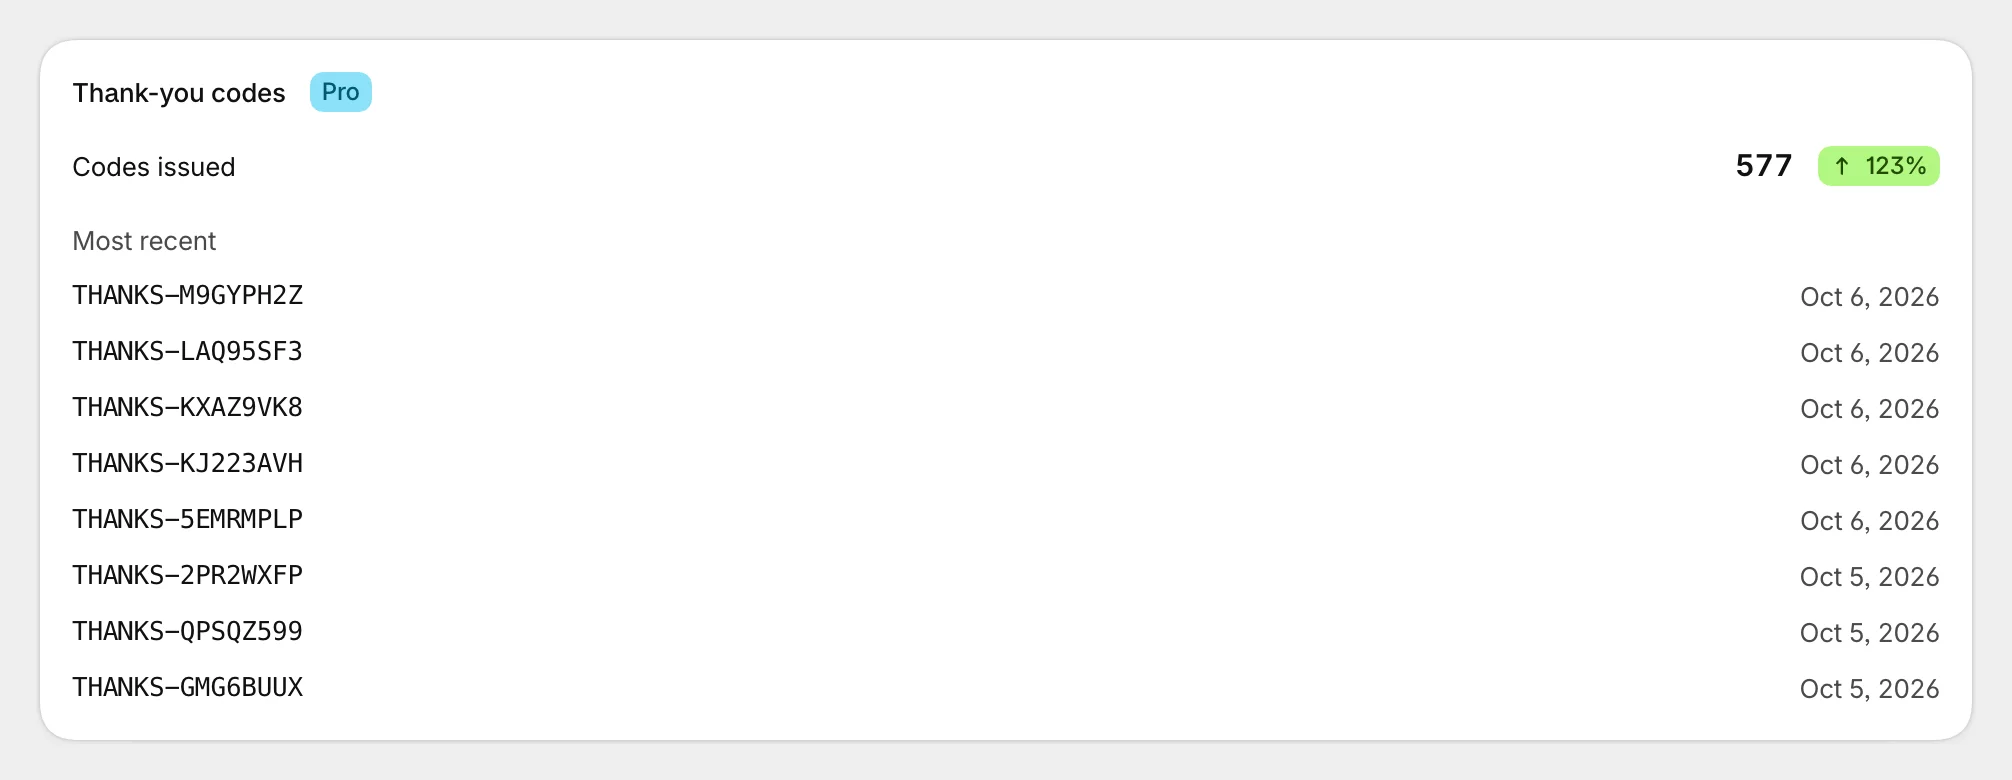
If you reward returning customers, this section counts the codes issued in the range and lists the newest. See Reward customers with a code for next time.
Was this helpful?