Read your quiz analytics
What each number on Analytics means, how it's counted, and how to compare periods and quizzes.
 Attravo TeamUpdated 2 min read
On this page
Analytics shows how many shoppers take your quizzes, how many finish, and the orders and revenue they bring in. It tells you which quiz earns its place and where to improve.
Choose the period
Open Analytics and choose a Date range: Today, Yesterday, Last 7 days, Last 30 days, Last 90 days, Last 365 days, This month, Last month or All time. It opens on Last 30 days.

Days follow your store's time zone. Each period is compared with the one just before it, such as the 30 days before the last 30. A period still under way is compared up to the same point, so today so far is measured against yesterday up to the same time. All time has nothing to compare with.
The headline numbers
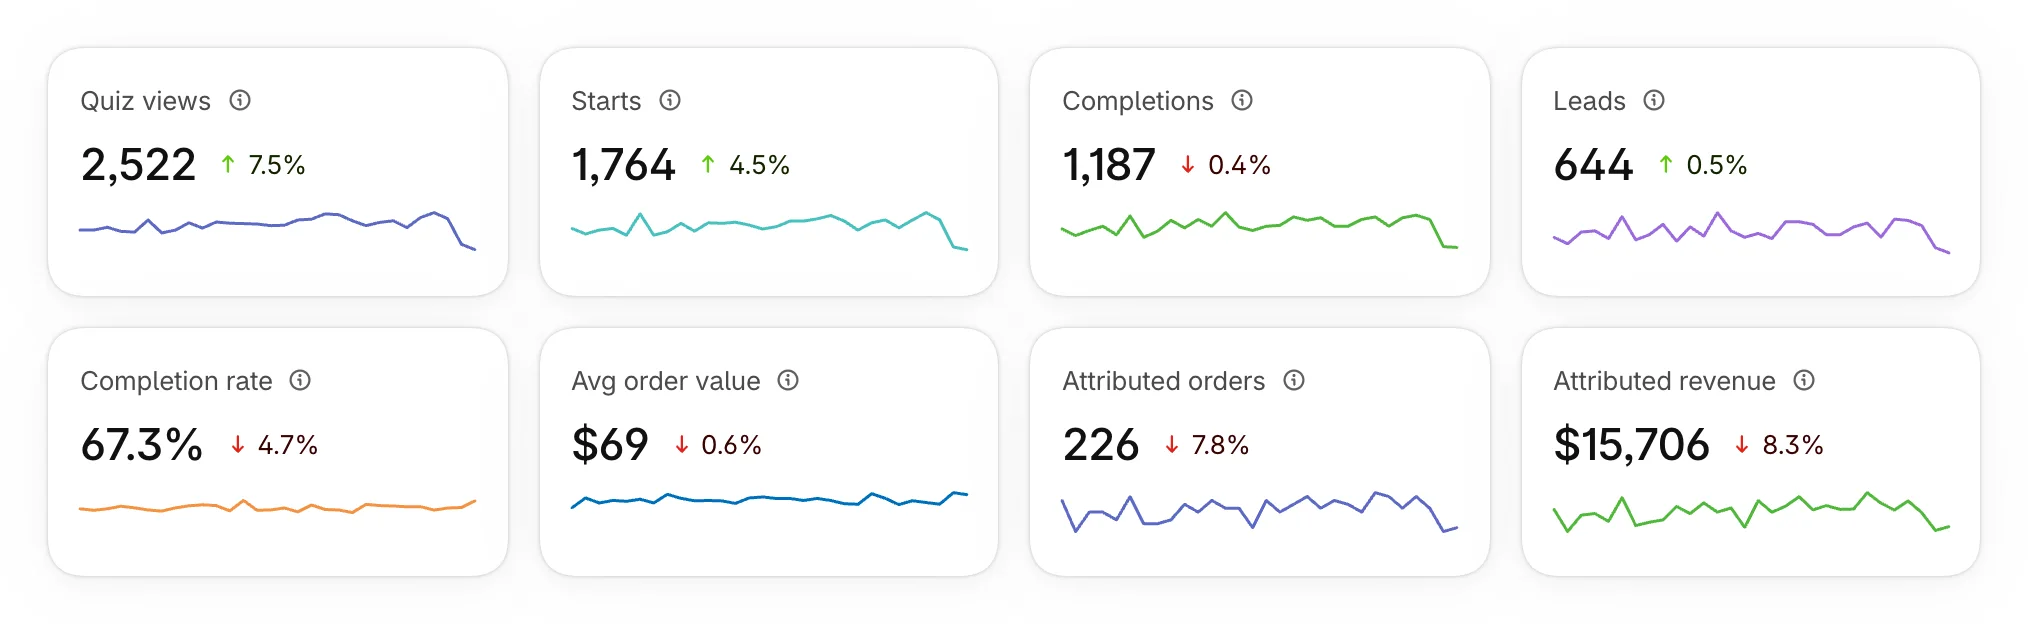
| Number | What it counts |
|---|---|
| Quiz views | Times a quiz loaded on your store. |
| Starts | Shoppers who answered the first question. Each counts once. |
| Completions | Shoppers who finished the last question and moved on to their results. Each counts once. |
| Leads | New emails captured in the period. The Leads page shows your all-time total. |
| Completion rate | Completions out of starts. Above 60% is healthy; below 40% often means the quiz is too long. |
| Avg order value | The average value of quiz orders in the period. |
| Attributed orders | Orders linked to a quiz by its cart or its discount code. |
| Attributed revenue | The totals of those orders, in your store's currency. |
Each number shows its change against the previous period and a small line of its trend. Hover the info icon next to a name to read what it counts.
How an order is linked to a quiz is in How quiz sales are counted.
Read the chart
Daily activity draws one metric across the period, with the previous period as a dashed line. Choose the metric in the menu: Completions, Views, Starts, Leads, Orders or Revenue.
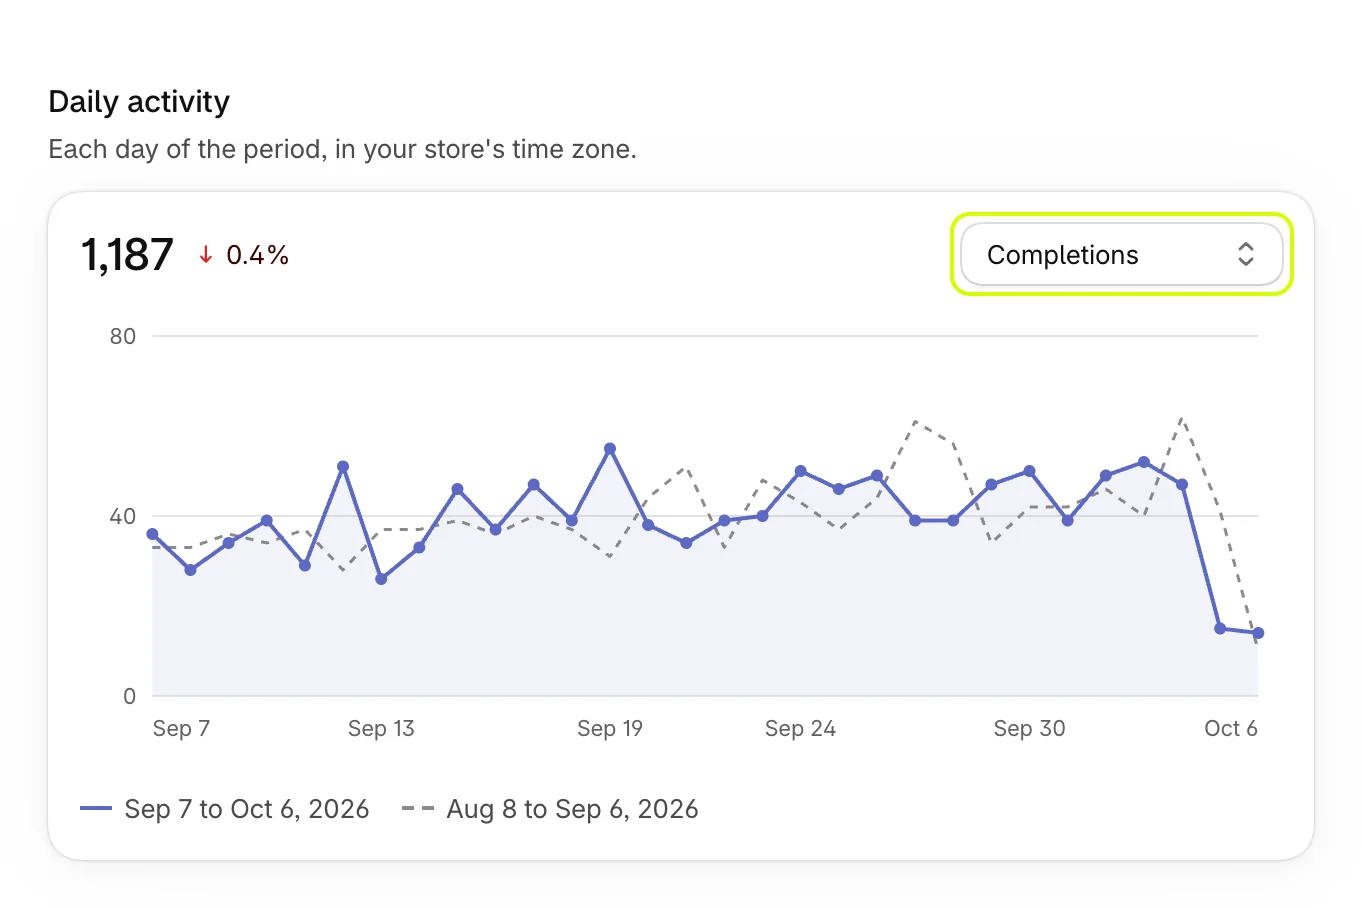
Hover the chart to read each day's figure beside the same day of the previous period.
Today and Yesterday show Activity by hour, and periods over 400 days show Monthly activity.
Compare your quizzes
Quiz performance lists each quiz's views, starts, completions, completion rate, orders and revenue for the period, with its status. Use Sort by to order the list by Views, Completions, Completion rate, Orders or Revenue.
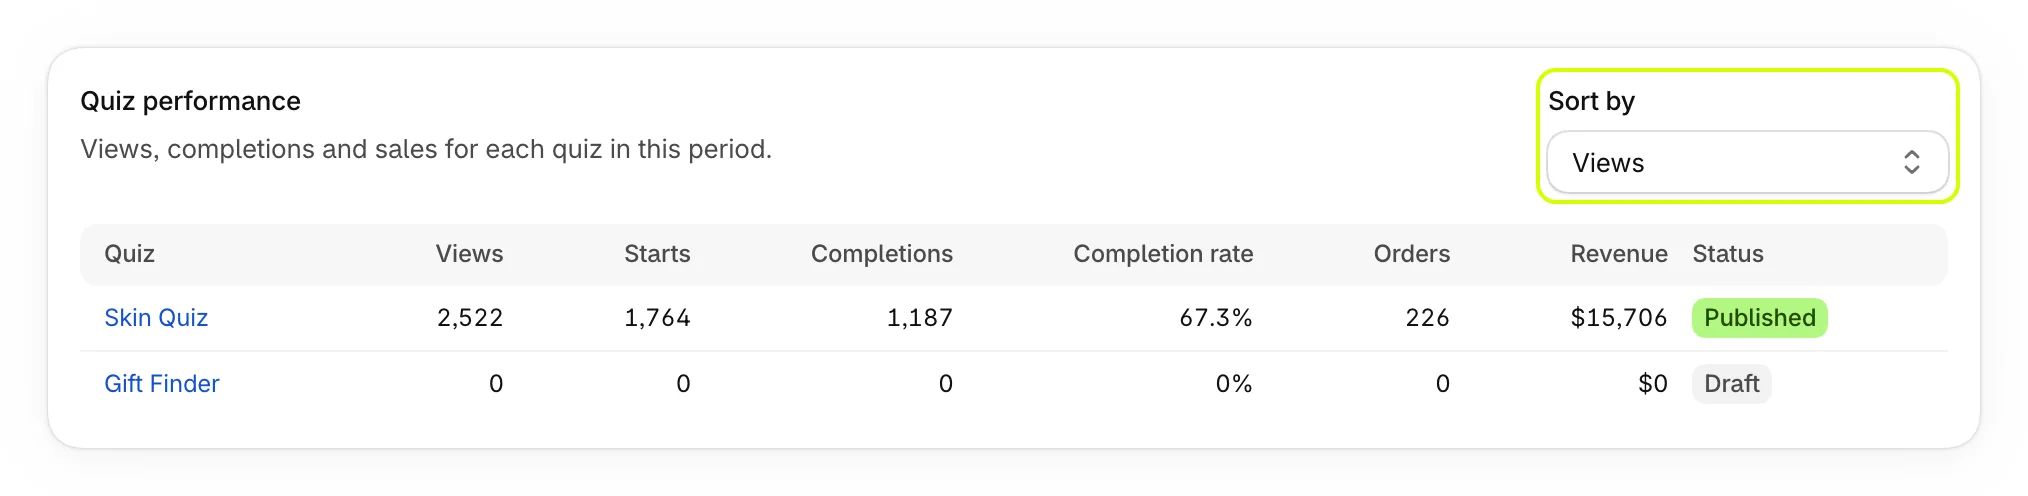
Select a quiz's name to open it in the editor. To see where shoppers leave, see Find where shoppers drop off.
On the Free plan
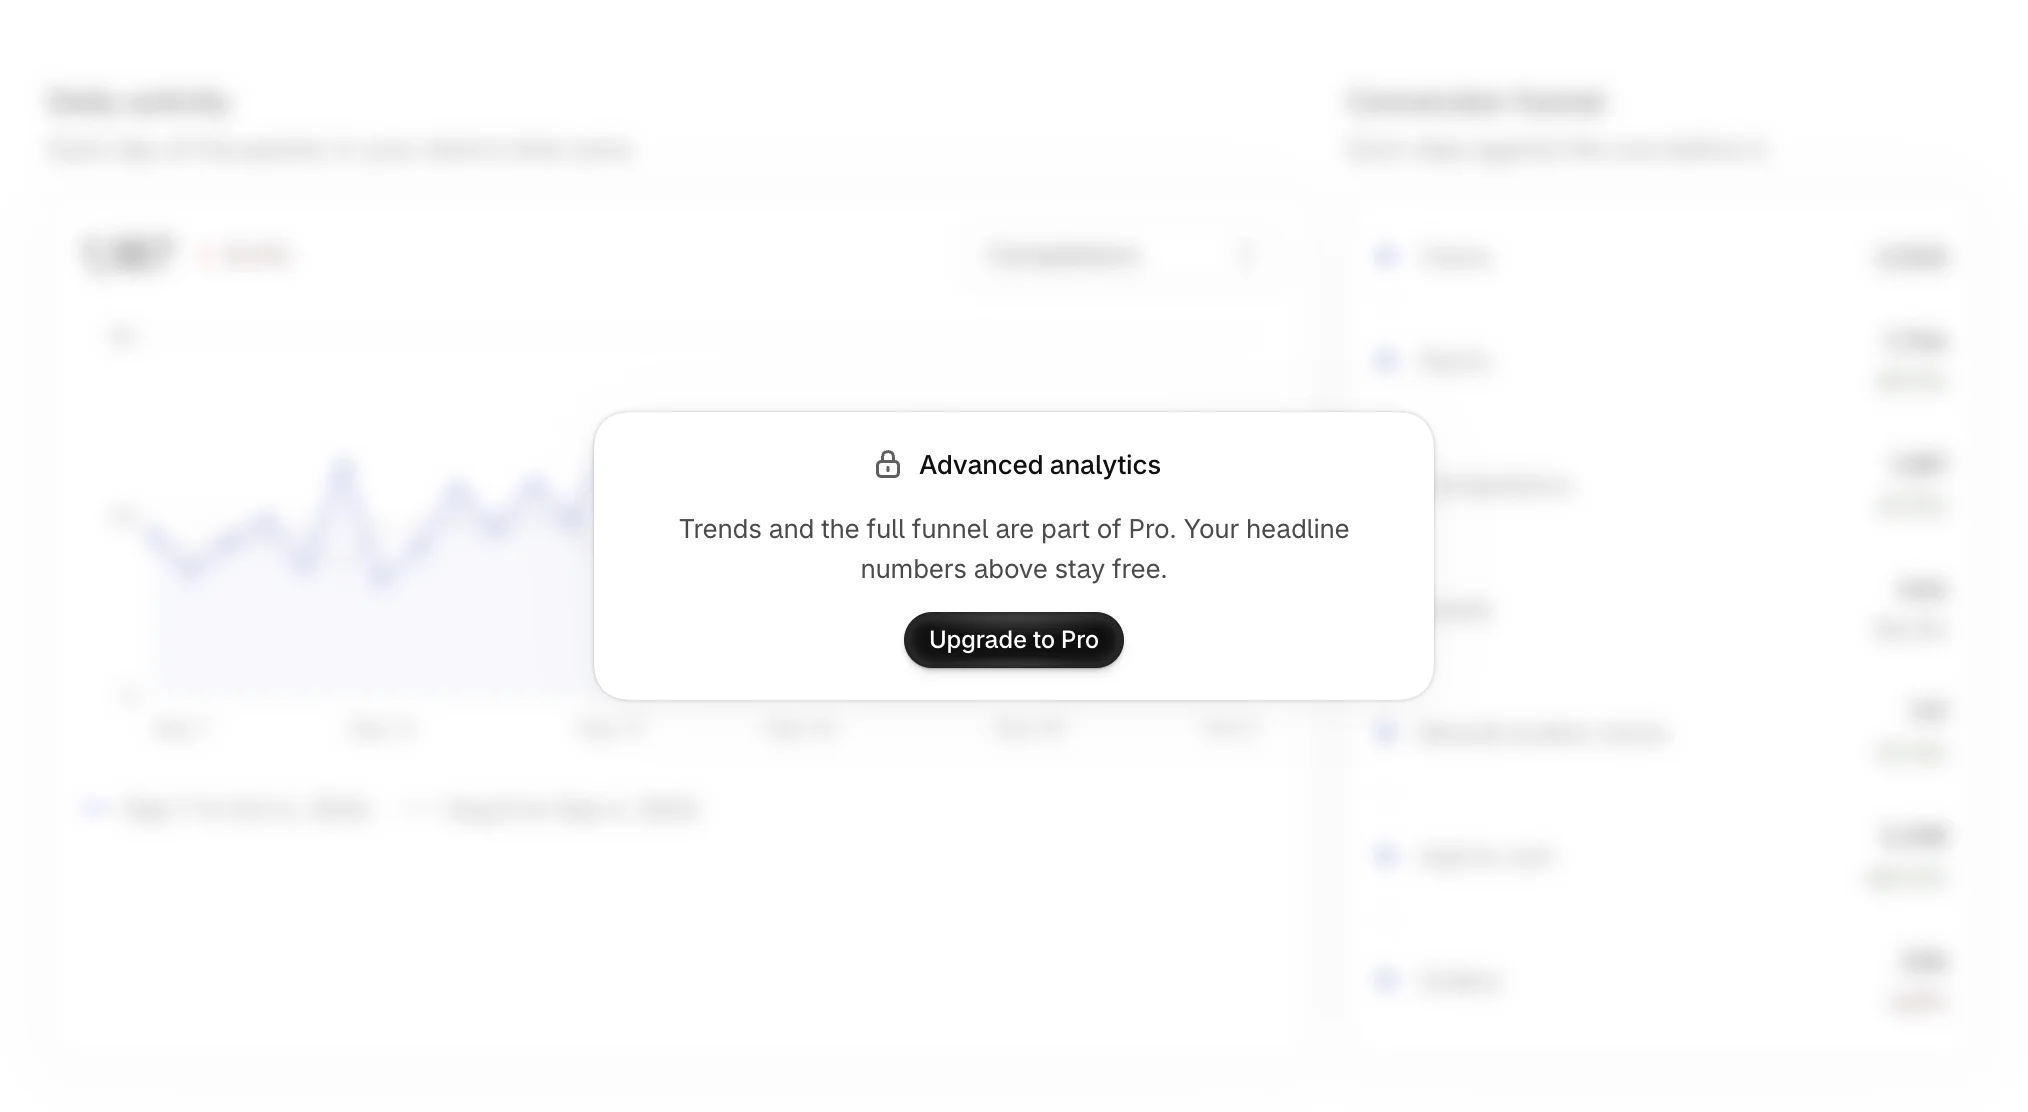
The headline numbers are free. The chart, the funnel and Quiz performance are part of Pro.
At a glance on Home
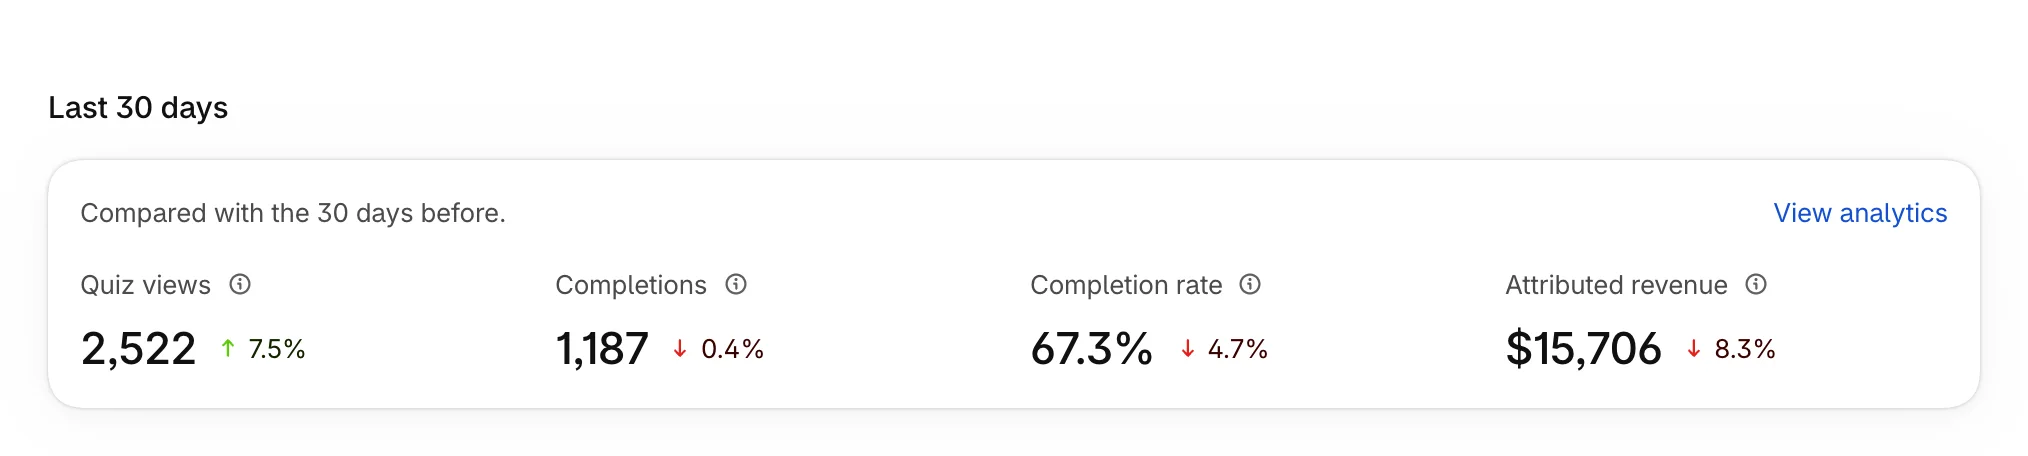
Home shows your last 30 days against the 30 days before, with View analytics to open the full page.
Was this helpful?